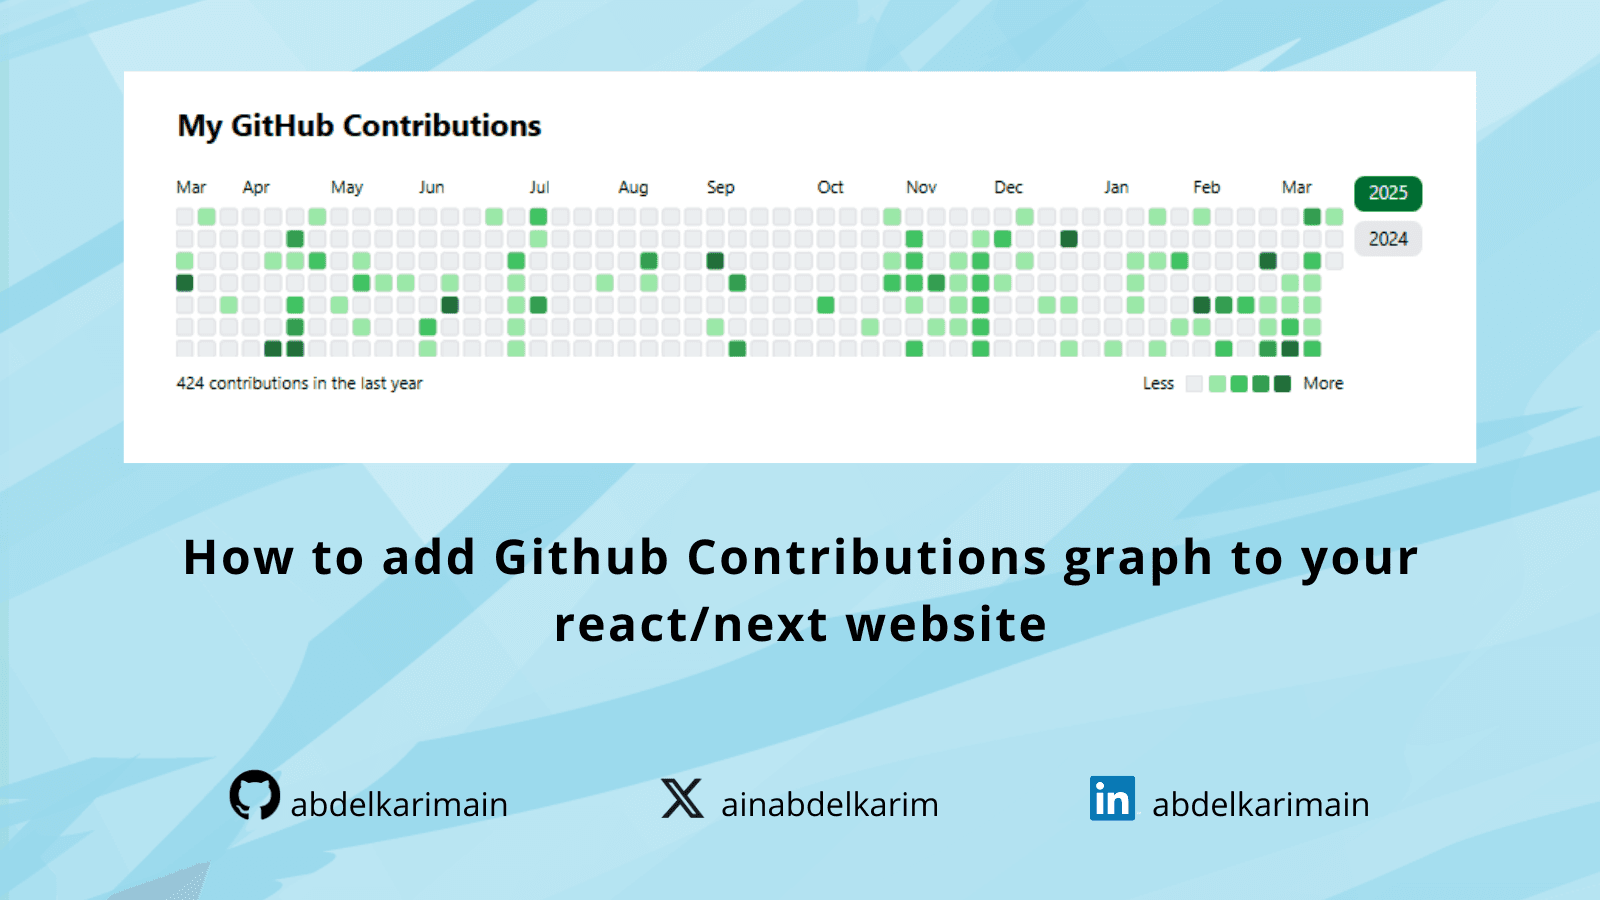
In this post, I’ll walk you through how I added a GitHub contributions graph to my React/Next.js website using the react-github-calendar library. I also implemented a feature to switch between different years of contributions. Here’s how I did it step by step:
Step 1: Install the Required Package
First, I installed the react-github-calendar package to easily display my GitHub contributions in a calendar format. I ran the following command in my terminal:
npm install react-github-calendarStep 2: Set Up the Component
I created a new component called GitHubContributions and imported the necessary dependencies. Here’s the initial setup:
// components/GitHubContributions.tsx
"use client";

import { useState } from "react";
import GitHubCalendar from "react-github-calendar";

export default function GitHubContributions() {
  return (
    <div className="mt-8">
      <h2 className="text-2xl font-bold mb-6">My GitHub Contributions</h2>
      <GitHubCalendar
        username="your_github_username"
        blockSize={10}
        blockMargin={3}
        colorScheme="light" // based on your theme
        fontSize={10}
        theme={{
          light: ["#ebedf0", "#9be9a8", "#40c463", "#30a14e", "#216e39"],
          dark: ["#161b22", "#0e4429", "#006d32", "#26a641", "#39d353"],
        }}
        year={2024} // year that you joined to github
      />
    </div>
  );
}
In this step, I used the GitHubCalendar component to display my contributions. I also added some basic styling and customization, such as blockSize, blockMargin, and a custom theme.
Step 3: Add Year Selection Buttons
To make the graph more interactive, I added buttons to switch between different years of contributions. Here’s how I did it:
- Calculate the Years: I calculated the range of years from my GitHub join year (2024) to the current year.
- Create Buttons: I mapped over the years and created a button for each one. Clicking a button updates the calendarYear state, which dynamically changes the displayed year in the graph.
Here’s the updated code:
// components/GitHubContributions.tsx

"use client";

import { useState } from "react";
import GitHubCalendar from "react-github-calendar";

export default function GitHubContributions() {
  const [calendarYear, setCalendarYear] = useState<number | undefined>(
    undefined
  );

  const joinYear = 2024; // year that you joined to github
  const username = "your_github_username";
  const currentYear = new Date().getFullYear();
  const duration = currentYear - joinYear + 1;
  const years = Array.from({ length: duration }, (_year, i) => currentYear - i);

  return (
    <div className="mt-8">
      <h2 className="text-2xl font-bold mb-6">My GitHub Contributions</h2>
      <div className="flex justify-between gap-2">
        <GitHubCalendar
          username={username}
          blockSize={10}
          blockMargin={3}
          colorScheme="light"
          fontSize={10}
          theme={{
            light: ["#ebedf0", "#9be9a8", "#40c463", "#30a14e", "#216e39"],
            dark: ["#161b22", "#0e4429", "#006d32", "#26a641", "#39d353"],
          }}
          year={calendarYear}
        />

        <div className="flex flex-row flex-wrap justify-start gap-2 lg:flex-col">
          {years.map((year) => (
            <button
              key={year}
              onClick={() =>
                setCalendarYear(year === calendarYear ? undefined : year)
              }
              className={`rounded-lg px-3 py-1 text-sm ${
                year === (calendarYear ?? currentYear)
                  ? "bg-[#006D32] text-white"
                  : "bg-gray-200"
              }`}
            >
              {year}
            </button>
          ))}
        </div>
      </div>
    </div>
  );
}
After that you can import GitHubContributions component in your page:
import GitHubContributions from "./GitHubContributions";
import Header from "./Header";
export default function Page() {
return (
<div className="max-w-5xl mx-auto px-6">
<GitHubContributions />
</div>
);
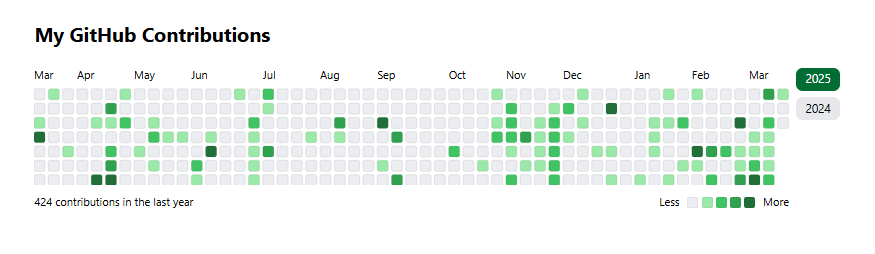
}and then Voila!
Step 4: Style the Component
I added some Tailwind CSS classes to style the component. The buttons change color based on the selected year, and the layout is responsive.
You can check https://github.com/grubersjoe/react-github-calendar for more details.
Step 5: Deploy and Enjoy!
Once I finished coding and styling, I deployed my website and tested the GitHub contributions graph. It worked perfectly! Visitors can now see your coding activity and switch between different years to explore your contributions over time.
If you found this post helpful, consider supporting my work by ☕buying me a coffee. Your support helps me create more content like this!